 Ask
AI for Excel: how to analyse spreadsheets and write reports
Contents
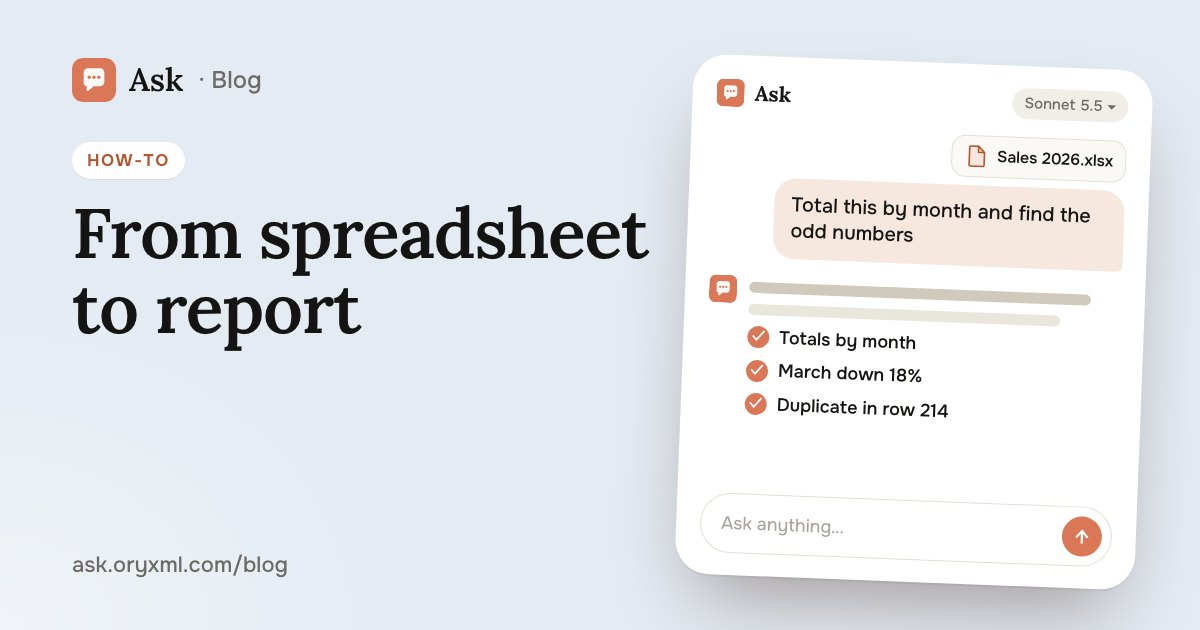
A spreadsheet with thousands of rows, and in an hour your boss wants to know “how are sales doing”. AI can quickly total it up, find the odd numbers, explain the formulas and write a short summary, leaving you to check what matters.
Step 1. Prepare and attach the file
- Attach the Excel file to a message in an Ask chat. If the table is on screen, a screenshot works; if it's in a report, a PDF. You can send up to 5 files per message.
- Make sure the columns have clear headers: “Date”, “Region”, “Amount, RUB”, not “Column1”.
- Remove what the analysis doesn't need: customers' phone numbers, names, ID numbers.
- In your first message, say what the table is and what you want to find out.
Try asking: This is a shop's sales export for January to October: date, product, category, quantity, amount. I want to know which categories are growing, which are falling, and which months had something unusual.
Step 2. Totals, trends and outliers
Start with the big picture, then drill down.
Try asking: Total the revenue by month and by category. Show it as a table and mark where the change from the previous month is over 20%.
Try asking: Find odd values in the table: amounts far above or below usual, negative quantities, empty cells, duplicate rows. List them with row numbers.
Outliers often turn out to be data entry errors rather than events: an extra zero, a return recorded as a sale, a duplicate. AI helps you find them; deciding what to do with them is up to you.
Useful questions:
- what changed most over the period;
- which five items bring in the most revenue;
- is there seasonality, and in which months;
- how this quarter differs from the last.
Step 3. A summary for your boss
Your boss rarely needs the whole table. They need three to five conclusions and what to do about them.
Try asking: Write a half-page summary for my manager: the key figures, the three main conclusions, one problem and what I suggest doing. No jargon, round the numbers.
Many people worry about presenting a summary like this: what if the boss asks where a number came from and there's no answer? So ask the AI to note, next to each conclusion, which rows or columns it comes from, and check those places yourself. Then you can answer any question.
If you need slides rather than a message, see how to make a presentation with AI.
Formulas: VLOOKUP, XLOOKUP, SUMIF
AI is good at explaining formulas and writing them for your table. Name the columns and sheets, and all that's left is to paste it.
| Task | Function | Example |
|---|---|---|
| Pull a price from another sheet | VLOOKUP or XLOOKUP | =VLOOKUP(A2,Prices!A:C,3,FALSE) |
| Sum with a condition | SUMIF | =SUMIF(C:C,"Moscow",E:E) |
| Sum with several conditions | SUMIFS | total by region and month |
| Count with a condition | COUNTIF | how many orders a manager has |
| Hide a #N/A error | IFERROR | a blank cell instead of the error |
Try asking: On the Orders sheet, column A has the item code; on the Prices sheet, column A has the code and column C the price. Write a formula that puts the price into column D of Orders. Explain each argument.
Try asking: Here's a formula from someone else's report, and I don't understand it:
=IFERROR(XLOOKUP(B2,Stock!A:A,Stock!D:D),0). Explain it in plain words.
Say which language your Excel is in: in the Russian version functions have Russian names (ВПР, ПРОСМОТРX, СУММЕСЛИ) and arguments are separated by semicolons. Google Sheets formulas can differ slightly too.
Cleaning the data
Before analysis a table often needs tidying, and that's the most tedious part of the job.
Try asking: The City column has the same city written different ways: “Moscow”, “moscow”, “Moscow city”, “Msk”. How do I make them all the same? Give step-by-step instructions for Excel.
You can also ask to:
- split full names or addresses into separate columns;
- turn dates stored as text into real dates;
- find and remove duplicates;
- explain why SUM shows zero (often the numbers are stored as text).
What to check yourself
- Totals. Compare the main sums with SUM in Excel itself. AI can make counting mistakes, especially on a large table.
- Conclusions. Each one should rest on specific rows. If the AI can't point to them, the conclusion is in doubt.
- Formulas. Test on two or three rows by hand before filling the whole column.
- Context. The AI doesn't know there was a promotion in March or that the warehouse closed in May. Add that to your request and the conclusions get sharper.
For large tables and complex analysis, the default model, Sonnet 5.5, works well, and on the Pro and Max plans you can pick Opus 5.5; more in which AI model to choose. If you run your own business, see AI for small business.
Frequently asked questions
Which spreadsheet files can I send?
Will the AI give me back a finished Excel file?
Can I trust the AI's calculations?
Is it safe to send a work spreadsheet?
Try it on your own task
Your first answer arrives in seconds. No VPN, no password, and there’s a free plan.
Ask for freeKeep reading
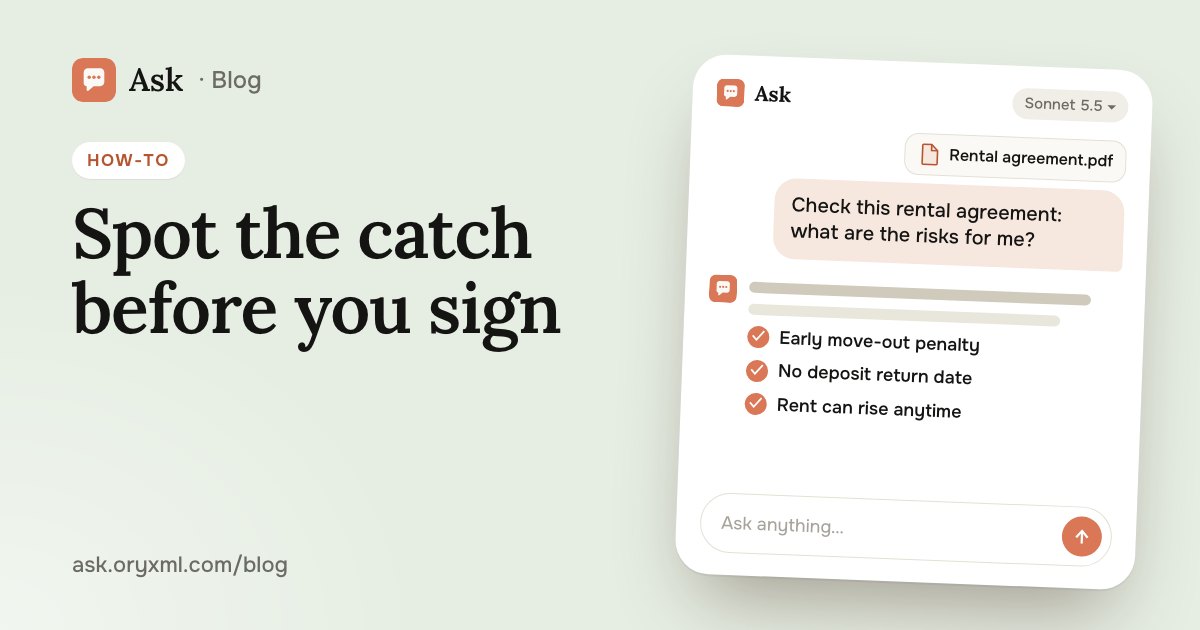
How to check a contract with AI: a step-by-step guide
Check a rental, employment, purchase or service contract with AI: what to ask about penalties, termination and hidden payments, and what AI can't replace.
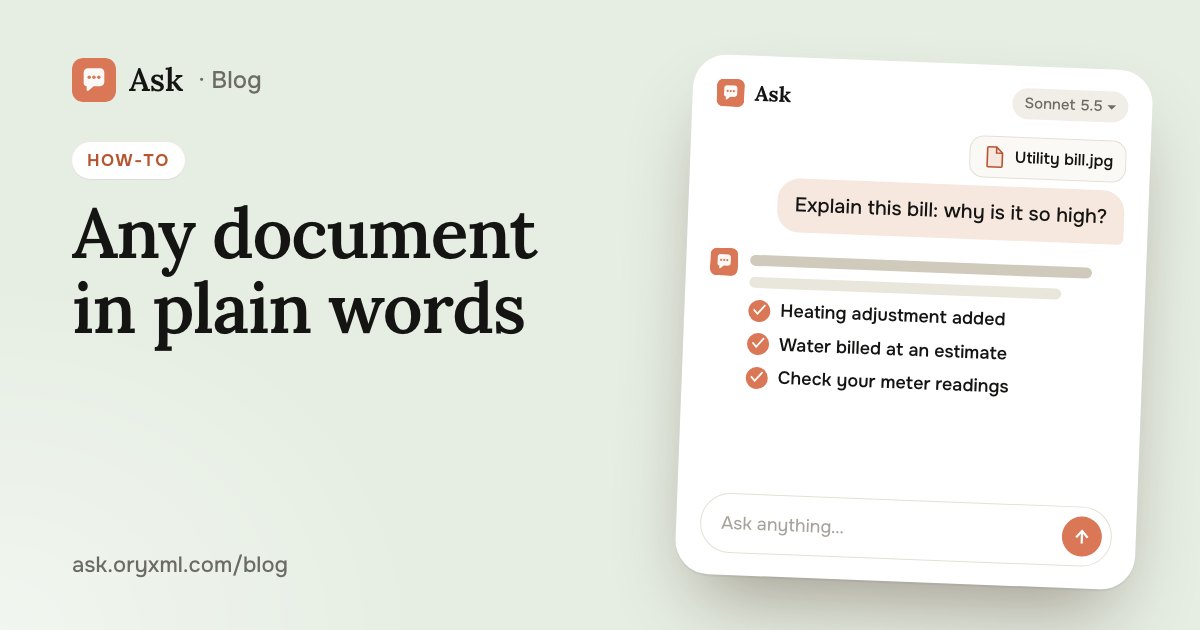
Explain a document from a photo with AI: bills, letters, lab results
Photograph a utility bill, bank statement, manual, official letter or lab results, and AI explains it in plain words. How to shoot it and what to cover first.

Job interview practice with AI: questions and a mock interview
Prepare for a job interview with AI: questions for your role, a mock interview with feedback, a strong tell me about yourself, salary talk and questions to ask.